Overview
This overview aims to provide some background information about the typical input datasets which are used widely in a wide range of biogeochemical and related applications as well as introducing some standard techniques of conversion and scaling required to use different sets in conjunction.
Types of data 
Meteorological or climatological data can originate from various sources. The choice of a relevant data set for application in ecological models depends on availability of the data, but the different sources have different strengths and weaknesses as well, which will be highlighted below.- Meteorological properties are measured in meteorological stations that are often part of a network by a national meteorological service, or set up to complement ecological observations, e.g. eddy covariance measurements of ecosystem fluxes. These data provide the best account of local meteorological conditions, but are valid for a limited spatial domain only.
- In regions where a dense network of station data is available, the information from all stations can be aggregated into a gridded data set. In this way, the data of irregularly-spaced stations are converted into a regular grid, averaging several stations for grid cells where the network is dense, and interpolating between neighbouring stations where the network is less dense. This has the advantage that a complete coverage can be obtained. However, the information in the gridded data set depends largely on the original station data that were used: If a large region is poorly covered by stations, the information in the gridded data set has large uncertainties.
-
General circulation models (GCMs) have been used since the 1960s for simulations of the (regional and) global climate, and were developed from existing models used for numerical weather predictions. These models simulate the movement of air (or, in the case of ocean GCMs, of water) based on first principles: the motion of fluids according to Navier-Stokes, the conservation of energy and mass, and the equation of state for ideal gases relating pressure and temperature to each other. To do so, the globe is divided into a discrete grid of points (or grid cells). For simulations of past and future changes in climate, GCMs (and other climate models) apply concentrations of greenhouse gases and other radiatively active compounds (e.g. aerosols from volcanic or anthropogenic activity) as forcing. Moreover, for simulations of paleoclimate, the orbital configuration of the earth can be altered from the present-day conditions.
Similar models, applying the same first principles, are applied on a higher spatial resolution with a smaller spatial domain. These mesoscale models or regional climate models need, apart from the input mentioned above, additional input at the boundaries of the domain. This input can be obtained from global GCM simulations or from reanalysis (see below).
-
Reanalysis applies climate models to provide an assimilation of different types of observed data (meteorological stations, satellites radiosondes, etc.) resulting in a climate model simulation that is consistent with these observations.
In comparison with the gridded station data, reanalysis data deviate more from the observed state, particularly in places with a dense station network. However, in areas with a sparse coverage of meteorological stations, the reanalysis data follow first principles and are therefore likely to represent the true climate better than when interpolating the stations over long distances. Moreover, the reanalysis data provide a consistent meteorology in three spatial dimensions; it contains more parameters than typically measured, and can be used for dynamical downscaling with regional climate models (see below).
- Proxy data are often used to obtain estimates of meteorological variables (e.g. temperature or precipitation) for the time before the instrumental record. These variables are reconstructed based on a large number of (functional and/or statistical) relationships between these variables and their traces in biotic or abiotic systems. E.g., because temperature and precipitation affect the growth of a tree's bark, variation in tree ring width contains information on the environmental conditions at the time of growth, which can be traced in old samples of wood.
- Satellite data
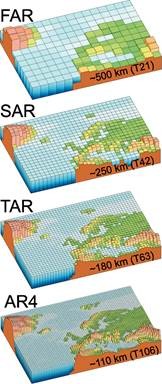
Fig. 1. Increase in spatial resolution of
global climate models between the IPCC's
first (1990) and fourth (2007) assessment
reports (Source: IPCC Fourth assessment
report, Working Group I: The Physical
Science basis, Figure 1.4.)
Data properties 
Data sets can be characterized by their spatial and temporal domain and resolution.
Spatial domain and resolution
Gridded data sets, e.g. from station data or climate models, can be characterized by their spatial domain (the area covered by the data set) and the spatial resolution (the horizontal interval between the individual points in the data set). Due to enhanced computational power and data storage, the spatial resolution of regional and global climate models has increased over years (Fig. 1).
-
Temporal domain and resolution
The temporal resolution of models is largely determined by the velocity of the processes simulated. Whereas the temporal resolution of a climate model might be ~minutes, output data are often provided on a coarser resolution, balancing the requirement for detailed data with the needs for data storage. Climate models therefore often provide data on 3-hourly or 6-hourly intervals. With enhanced spatial resolution, the distances of transport become shorter, and therefore this enhancement requires an increase in the temporal resolution as well.
Upscaling and downscaling of climate data 
- Interpolation: If two or more different data sets have a different spatial resolution, interpolation can be applied to allow for a combination of these data sets in one analysis. It should be noted that this does not add information to the data set, and should therefore only be used to combine data sets that are at different resolutions.
- Statistical downscaling: Downscaling of climate data can be done by applying statistical relationships between climatic parameters (e.g. temperature) and environmental drivers of their small-scale variability (e.g. elevation). In the resulting data set, large-scale variations are determined by the climate model, and small-scale variations by the statistical relationships.
- Dynamical downscaling: Rather than using statistical relationships for downscaling, one can apply meteorological models at a smaller scale to obtain an estimate of the variability at smaller scales. Regional climate models or mesoscale models can be applied with GCM output or reanalysis as boundary conditions. In these simulations, the variability is a combination of the large-scale signal produced by the GCM, and the small-scale variability simulated by the regional climate model. Compared with statistical downscaling, dynamical downscaling follows meteorological rather than statistical relationships, and is therefore particularly suited for application outside the domain of model parameterization.
Application and combination of data sets 
-
Actual vs. statistical past: Climate model (or Earth system model) simulations can be separated into “free” and “forced” simulations. “Forced” simulations apply a forcing that makes the simulations match the actual past by prescribing observed conditions. This can be e.g. sea surface temperatures or volcanic activity for global simulations, or reanalysis as boundary conditions for regional simulations.
“Free” simulations do not have these driving conditions that force them to observations. Statistically, these simulations can still represent a period in the past, but one cannot expect the similarity between simulated and observed climate to be the dominating signal, particularly not on shorter time scales, where variability in weather conditions take place.
In practice, global climate model simulations for the 20th century are often forced with observed greenhouse gas concentrations. Whereas this is a “forced” simulation, the smooth greenhouse gas forcing constrains the simulation only to a limited extent. Long-term (decadal) trends from these simulations can be presumed to reflect the past, but the shorter-term variability is at best statistically comparable to the past. It needs no explanation that, in a lack of e.g. observed sea surface temperatures, simulations for the future can only be considered statistical representations, and not actual predictions of shorter-term variability.
- Using and constructing future scenarios (consistency, anomalies)
Specific datasets: Land cover / land use recent data, historical data and projections
Land cover and land use are often used synonymously. While land cover describes the physical cover of the land (i.e. the type of vegetation), land use is a classification of the actual use of the land by humans. Since many and cover classes directly reflect the use of humans, e.g. croplands, both data sets are strongly linked to each other.
Land cover 
The land cover can either be determined by field surveys or remote sensing. While some fine scale maps (e.g. within a municipality) rely on field surveys, the majority of datasets available is derived from remotely sensed reflectance data.
One of the most commonly used European wide data set for land cover is the CORINE land cover (CLC2000) data. It originated from an effort of the EEA to generate and regularly update a common database with similar classification schemes. CLC2000 is an update of a previous version (CLC90). Hence also land cover (or in some cases land use) change effects can be analysed. However, since the classification schemes have been adapted and the resolution of the input data increased between the two datasets some inconsistencies exist between the two data sets. Since each individual partner state is performing the classification, the different states provide different fine scale data sets in different formats. Additionally, a harmonized European gridded dataset with a 500 m resolution is available with the following classification scheme.
Historical land use 
The CLC2000 data can be used to infer the current land use at a certain resolution. However, since the current vegetation is a product of previous land use activities also past land use is of interest in a number of applications.
The Historical Database of the Global Environment (HYDE3.1, Klein Goldewijk et al., 2011 and references therein) is a spatially explicit dataset of human-induced global land-use. It is based on population density historical records, remotely sensed images of contemporary land-cover and land-census data and modelling. HYDE3.1 defines the relative share of croplands and pasture lands during the period 10000 BC to 2000 AD (with a millennial resolution before AD 0, a centennial resolution until AD 1700 and a decadal resolution thereafter).
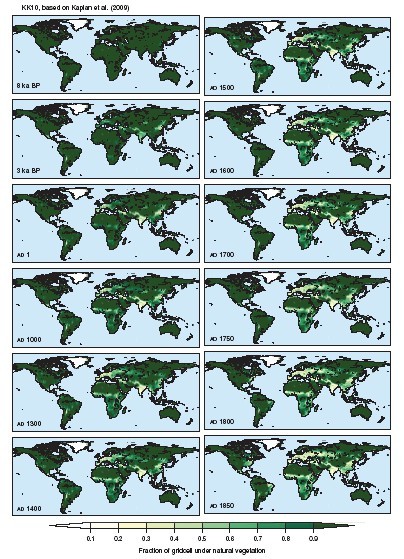
Fig. 2. Fraction of gridcell under natural vegetation from KK10 dataset.
The Kaplan and Krumhardt 2010 dataset (KK10, Kaplan et al. 2010 and references therein) consists of an annually resolved time series of anthropogenic deforestation over the past 8000 years. KK10 was created by by 1) digitizing and synthesizing a database of population history for Europe and surrounding areas, 2) developing a model to simulate anthropogenic deforestation based on population density that handles technological progress, and 3) applying the database and model to a gridded dataset of land suitability for agriculture and pasture to simulate spatial and temporal trends in anthropogenic deforestation. The simulations are based on historical observations and estimates of population density, climate, soil properties, land suitability for cultivation and pasture and take into consideration technological developments.
Both the HYDE 3.1 and the KK10 datasets have a spatial resolution of 0.5°x0.5°. The KK10 scenario makes the central assumption that humans use land more intensively in all regions of the world with increasing population density and land scarceness. In contrast, the standard version of the HYDE is based on a nearly linear relationship between population and area of land under agriculture, and shows very little variation in per capita land use.
References
Kaplan, J., Krumhardt, K.M., Ellis, E.C., Ruddiman, W.F., Lemmen, C., Klein & Goldewijk, K. (2010) Holocene carbon emissions as a result of anthropogenic land cover change. The Holocene, doi: 10.1177/0959683610386983.
Klein Goldewijk, K., Beusen, A., van Drecht, G. & de Vos M. (2011) The HYDE 3.1 spatially explicit database of human-induced global land-use change over the past 12,000 years. Global Ecology and Biogeography, 20, 73-86. doi: 10.1111/j.1466-8238.2010.00587.x